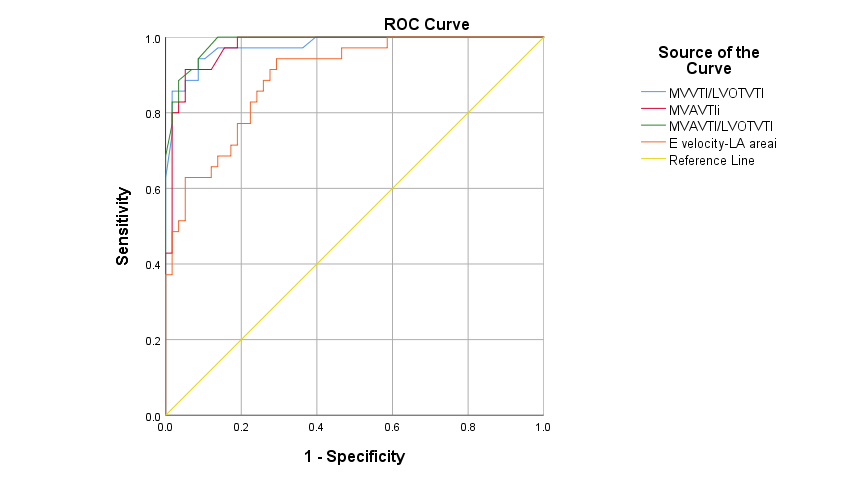
Background Mitral regurgitation (MR) is the most common valvular heart disease. Since delaying severe MR treatment can lead to left ventricular dysfunction, early MR diagnosis is crucial. Echocardiography is the first-line diagnostic modality for evaluating MR severity. Transesophageal echocardiography (TEE) and newer imaging modalities like cardiac magnetic resonance imaging (CMR) are growing to be used due to the pitfalls of transthoracic echocardiography (TTE). However, these newer modalities have disadvantages, such as high cost, requiring highly-skilled operators, and expensive devices, that make them not widely available in developing countries. We evaluated novel TTE-derived hemodynamic burden parameters of MR to estimate and classify MR severity more precisely. Methods We prospectively enrolled 93 patients with primary MR from April 2022 to August 2022. We obtained the baseline characteristics and the following TTE parameters: mitral valve (MV) velocity-time integral (VTI), left ventricular outlet (LVOT) diameter (D), LVOT VTI, and mitral valve annulus (MVA) diameter. The statistical analysis was performed using SPSS. Results A total of 93 MR patients with a median (interquartile range) age of 59.00 (50.50-65.00) were recruited, of whom 38 (40.9%) were female. Of the 93 patients, 29 (31.2%), 29 (31.2%), and 35 (37.6%) were classified into mild, moderate, and severe MR, respectively. The four parameters of MVVTI/LVOTVTI, MVAVTI-index (i), MVAVTI/LVOTDVTI, and E velocity-LA area-i were shown to be significantly different among mild, moderate, and severe MR groups (p-values <0.001). Spearman’s correlation test indicated that MVVTI/LVOTVTI, MVAVTI-i, MVAVTI/LVOTDVTI, and E velocity-LA area-i were highly and significantly correlated with MR severity classification with correlation coefficients of 0.776, 0.672, 0.822, and 0.698, respectively (p-values <0.001). The ROC-curve analysis demonstrated that all parameters were significantly accurate predictors of severe MR diagnosis. The area under curve (AUC) of the MVVTI/LVOTVTI, MVAVTI-i, MVAVTI/LVOTDVTI, and E velocity-LA area-i were 0.976, 0.975, 0.986, and 0.895, respectively (p-values <0.001) Conclusion We introduced novel TTE-derived MR hemodynamic burden indices. These indices were highly correlated with MR severity. Furthermore, they were significantly accurate predictors of severe MR. Proposing such new indices to older measures may improve their predictive value.