Dimaghi Schwamback

and 7 more

Similar to most countries, the Brazilian water resources management considers topographically delineated catchment as a territorial unit for policy implementation. Yet, previous studies have shown that catchments are not hydrologically isolated, and topographic limits often neglect the groundwater boundaries. Thus, studies on effective catchment area are promising for shedding light on inter-catchment groundwater flow. Here, we investigated the deviation between the topographic and effective areas across Brazil. We applied the Effective Catchment Area index (ECI) to 733 Brazilian catchments and identified the most influencing attributes on the ECI by using Principal Component and Random Forest Analyses (PCA and RFA, respectively). Further analysis of consistency was carried out by contrasting the ECI values against the expected range of the Budyko curve considering both topographic and effective catchment areas (classic and adjusted framework). Considering the studied catchments, 15% and 16% of their effective areas were respectively smaller than half (strong losing water condition) and larger than double (strong gaining water condition) of their corresponding topographic areas. The aridity index was the main driving factor and negatively correlated with ECI followed by mean slope, precipitation seasonality, and mean elevation. In general, the more arid biomes in Brazil — the Cerrado and Caatinga — are prone to have smaller effective areas while larger effective areas were mostly found in the Atlantic Forest biome, a humid tropical region with a higher mean elevation. We highlight the potential of adopting a pooling of catchments based on their interconnectivity to minimize management costs while maximizing synergies and lessening trade-offs of water transfer processes. Our results contribute to a better country-scale understanding of hydrological connectivity among catchments and highlight the need to consider the effective catchment area to overcome water-food-energy security challenges on multiple scales.

Dimaghi Schwamback

and 2 more

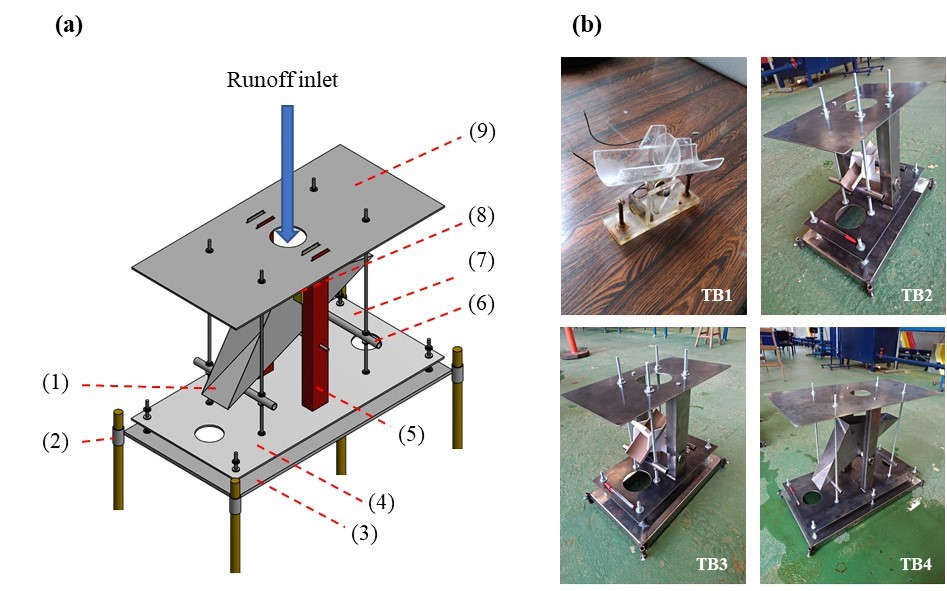
Inherent errors in tipping bucket flow meters may limit monitoring data reliability. In this work, we perform the static and dynamic calibration of four large tipping buckets, apply different regression curves and investigate the possible measurement error sources. The volumetric capacity (static calibration) of each piece of equipment was determined. They were tested (dynamic calibration) under ten flow intensities, ranging from low to high rainfall intensities (return period larger than 100 years). For each flow rate, the measurement was recorded during six time intervals (1, 2, 5, 10, 20 and 30 minutes) and four regression equations - linear, potential, T vs. 1/Q and quadratic - were tested. According to the static calibration, the equipment has a volumetric capacity of 11.63 mL (TB1), 64.16 mL (TB2), 139.86 mL (TB3) and 660.95 mL (TB4). When tested under different flow rates (dynamic calibration), underestimations were identified according to the size of the cavity: TB1 (3.31%), TB2 (5.75%), TB3 (9.33%) and TB4 (13.57%). Among the alternative curves, linear regression showed the best correlation (above 99%) with the monitored data. Using this method, the measurement errors were reduced to -1.35% (TB1), 0.04% (TB2), 3.18% (TB3) and 3.73% (TB4). We investigated how the different variables (tipping speed, cavity volumetric capacity and time interval of data collection) influenced the error. Errors follow a parabolic function of tipping velocity and a linear function of cavity volumetric capacity. The time interval of data collection interfered in the data sampled, however no statistical correlation was found. Among those variables, cavity size is the most important one. Given its low cost we aimed to minimize the inherent error in large tipping buckets flow meters and encourage its application, increasing in-situ collection of hydrological data.